
Cornerstone 3rd Quarter 2026 Commentary

October 30, 2026
Transitory – Really?
“If you put tariffs in place, it creates inflation. If you put inflation in place, you have to raise interest rates. You raise interest rates, and stock markets shouldn’t be so high.” – Bill Browder
“Spending money to be paid by posterity, under the name of funding, is but swindling futurity on a large scale.” – Thomas Jefferson
“The big question is: When will the term structure of interest rates change? That’s the question to be worried about.” – Ray Dalio
“Monetary policy is like juggling six balls… it is not ‘interest rate up, interest rate down.’ There is the exchange rate, there are long term yields, there are short term yields, there is credit growth.” – Raghuram Rajan“If I was counselling an individual, and my purpose was to help that individual, the most important thing would be that you should save more. Because don’t expect that your retirement will follow those trajectories that some advisers are telling you.” – Robert Shiller
When I look back over the last six years since the outbreak of Covid, I can’t help but think that my arguments related to the constraint on the growth of inflation were relatively sound and backed by academics and practitioners alike. It is little consolation that I was cautious in my “framing” and noted that monetary policy was accommodative. As time progressed and we witnessed the extreme fiscal largesse of the previous administration, we did note the inflationary nature of these decisions. However, with the benefit of hindsight, I fully admit I did not expect the level of inflation we have experienced over the intervening years or the way that monetary and fiscal policy would combine with AI-driven import demand and a couple of wars to once again push prices higher, resulting in additional inflationary pressure. Perhaps I should have noted that despite the demand for dollars brought about by foreign investment in Treasuries and the relatively low level of monetary velocity, the absolute increase in the monetary supply would at some point add to inflationary pressure. Regardless, that is where we find ourselves!
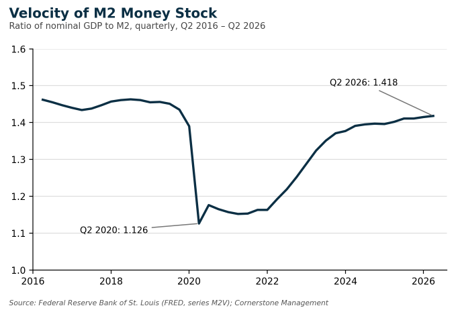
Was inflation transitory? Our answer is no, at least not in the sense the term was used in 2021. Headline CPI rose 3.7% over the twelve months ended September, up from 3.4% in August, and energy prices, up 20.4% over the year, explain much of that. Core CPI, at 2.6%, looks tamer, but core PCE, the Fed’s preferred gauge, is running 3.0% (August), and money growth has not slowed: M2 is up about 5.7% over the past year and M1 about 6%. Meanwhile, the velocity of M2, which fell to roughly 1.13 in 2020 and stayed near 1.15 through 2021, has recovered to 1.42, so each dollar in a larger money stock is turning over faster. That combination, a larger money supply circulating more quickly, is consistent with persistent rather than transitory price pressure.
Over much of the last 20 years, inflation has run at a lower level than we had experienced during most of the post war era. Many investors have not experienced higher rates of inflation and the correspondingly high interest rates that are required to bring inflation back under control. When we look at the “longer term,” say 75-100 years here in the U.S., inflation has run around 3%; however, from 2009-2019 it ran significantly below that level, and interest rates were also low throughout that period.
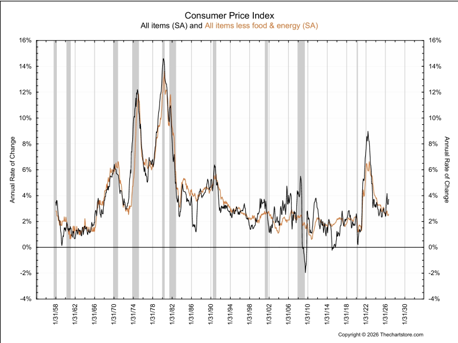
The low interest rate regime was challenging for savers, and there were many theoretical discussions about Modern Monetary Theory (MMT) and the supposed ability of governments to spend money ad-infinitum. Unfortunately, these concepts coincided with Covid, and the U.S. government spent massively during and after the pandemic. The debt burden of the U.S. went up significantly. Alongside the U.S., the global supply of money went up as many countries also spent heavily around the pandemic. All that spending is now coming home to roost as inflation has remained stubbornly high.
Correspondingly, central banks around the world have sought to combat inflation by raising interest rates. However, although the Fed and other central banks can exercise some level of control on short term interest rates, longer term interest rates are set by the market.
Source: Barron’s
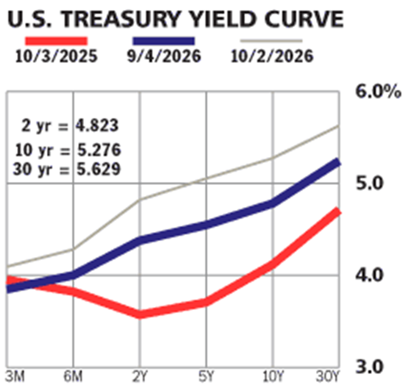
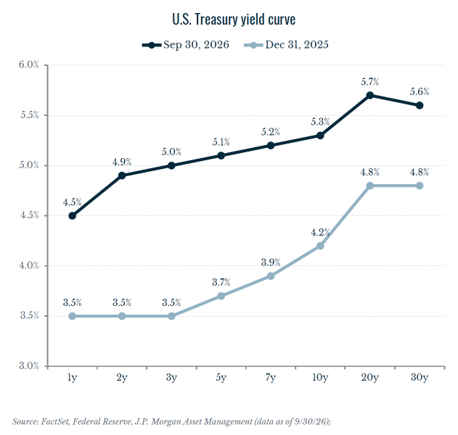
The combination of rising debt burdens and inflation is a challenging mix, and consequently, the entire yield curve in the U.S. and much of the developed world has shifted up. This move was particularly pronounced in the third quarter of 2026. Not only did the Fed raise interest rates by 25 basis points at their September meeting (to a 3.75%-4.00% range, the first increase since 2023), but longer-term rates moved up sharply as well. Since year-end, the 10-year Treasury yield has risen from 4.2% to 5.3%, the 30-year from 4.8% to 5.6%, and the 2-year from 3.5% to 4.9%. Interest rate moves not only affect the bond market, but they have significant implications for the stock market and the economy as well.
Theoretically, equity prices are a reflection of future earnings discounted back to the present at a rate of interest. As interest rates rise, the value of that future stream of income is worth less in today’s dollars. This puts the “multiple” of earnings that today’s investors are willing to pay for a company under pressure. A portion of the run-up in equity prices since the 2022 decline has been driven by multiple expansion, and although earnings growth has been and continues to be significant, higher rates negatively impact potential equity price appreciation. Higher interest rates also act as a brake on the broader economy. They slow house price appreciation and sales because higher interest rates limit the size of mortgage consumers can afford. They also limit business expansion. However, market-derived interest rates also help provide a level of protection to the economy. They can force governments to dial back spending just as they force fiscal responsibility on consumers and businesses. Ultimately, as the old adage goes: the cure for higher interest rates is higher interest rates.
The U.S. and global economy have been expanding on the back of the AI-driven investment boom, but along with that boom has now come an increase in corporate debt issuance. The world is awash in debt! All this debt has to find a clearing price, and with inflationary pressure remaining high and credit risk rising, investors are demanding higher rates from both government and corporate borrowers. At some point interest rate pressure may lead to a slowdown in the economy or even a recession, but we do not see that in the immediate future. At present, even with a modest increase in the Fed funds rate, monetary policy is hardly tight, and many might even suggest it remains accommodative. With headline CPI at 3.7% and the Fed funds target range at 3.75%-4.00%, the real policy rate is only about +0.2%. Certainly, the Taylor Rule would suggest that a much higher Fed funds rate is currently required to tamp down inflation.
(The Taylor Rule was proposed by John Taylor in an academic paper back in 1993. A full explanation of the model is beyond the scope of this commentary, but suffice it to say that the model has been heavily referenced by the Fed over the intervening years. The model focuses on the neutral rate of interest, the gap between current inflation and the Fed’s inflation target, and the output gap between current and potential GDP. The model is designed to suggest where short-term interest rates should reside for a given inflation target, say 2%. Depending on the form of the model and the inputs utilized, it would suggest that the Fed funds rate should be 1.4-3.5 percentage points higher than the midpoint of today’s 3.75%-4.00% range, assuming a 2% neutral rate and CBO’s estimate of potential GDP (a 1% neutral rate narrows the gap to roughly 0.4-2.5 points).)
Taylor Rule–implied Fed Funds rate (neutral rate 2%, inflation target 2%, output gap about +0.8%)
| Inflation measure | 1993 rule | 1999 rule |
| CPI, Sept. (3.7%) | 7.0% | 7.4% |
| PCE, Aug. (3.4%) | 6.5% | 6.9% |
| Core PCE, Aug. (3.0%) | 5.9% | 6.3% |
| Core CPI, Sept. (2.6%) | 5.3% | 5.7% |
| Fed Funds target range | 3.75-4.00% | 3.75-4.00% |
Source: Federal Reserve, BLS, BEA, Congressional Budget Office; Cornerstone Management calculations.
Chairman Warsh seems to be committed to addressing inflationary concerns, and this fact plus the broader concerns already mentioned led to a fixed income bloodbath during the third quarter. The rise in interest rates also negatively affected other more interest-rate sensitive sub-asset classes like small cap stocks and REITs which gave back much of the gains won in the previous quarter.
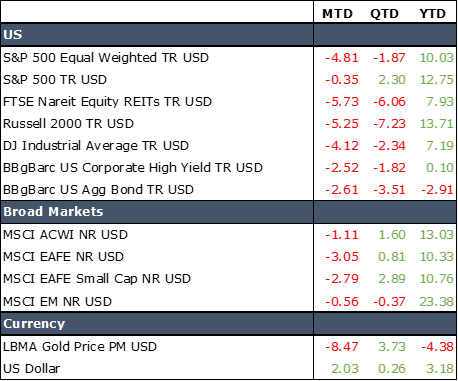
The Bloomberg U.S. Aggregate Bond Index declined by 3.51% during the quarter, and the Global Agg was off 2.46%. Both indexes are now down nearly 3% for the year. Once again, this moves both indexes into negative territory on a five-year rolling basis. Negative returns in the bond world are rare, and the current scenario also speaks to the relatively unprecedented “zero” rate regime of Covid. Ten-year returns also remain at historic lows because the interest rate market never really normalized following the Great Financial Crisis of 2008/2009. Perhaps Chairman Warsh will really hold to his plan to “let the markets determine the real rate of interest” and stop trying so hard to provide monetary accommodation. In our view, this would not only allow for a healthier economy in the longer term, but it would also likely force the government to address the U.S.’s looming debt issue.
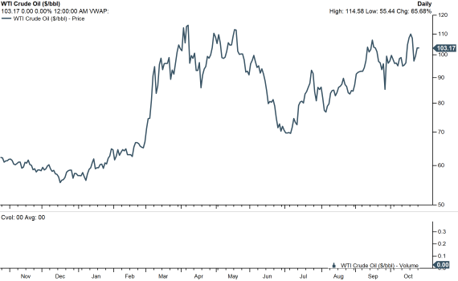
On the surface, equities continued their upward trend, but the truth was more nuanced as many areas of the market struggled and headline numbers were a bit deceiving. This can be best seen by a simple comparison between the S&P 500 Composite Index and the S&P 500 Equal Weight Index. The former was up 2.3% while the latter declined 1.87% during the quarter. That 4+ percent delta is indicative of both the relatively weak performance of the average stock in the index and the comparably strong performance by tech and communication services along with the energy and healthcare sectors. Of course, energy is no surprise with oil prices moving back above $100 per barrel.
Source: FactSet
In the large capitalization space, there continues to be divergence, with the Russell 1000 Value Index outperforming the Russell 1000 Growth Index for the quarter. However, this is somewhat misleading because there is now significant overlap between the two indexes. Historic growth names like Apple reside in both indexes, and stocks like Micron Technology contributed substantively to the Russell 1000 Value Index before being moved out of the index. The skew is pronounced and is not always indicative of a broadening market. Smaller capitalization names were hit hard by rising oil prices and interest rates. The Russell 2000 Index was down 7.23% during the quarter bringing its year-to-date performance back in line with the S&P 500 and the ACWI. REITs were also negatively impacted by rising rates and gave back 6% during the quarter, bringing their year-to-date return to 7.93%. International stocks were mixed during the quarter. The MSCI EAFE index was up 0.81% while the MSCI Emerging Markets Index declined 0.56% over the same period. Rising interest rates and a moderately strong dollar also led to a decline in the price of gold. The precious metal is now down almost 5% on a year-to-date basis. So once again while the S&P 500, ACWI, and NASDAQ indexes were up, much of the market actually declined during the quarter, and, unlike the second quarter of 2026, positive performance was narrow and limited to a few specific names and sectors. It was a very difficult quarter for active managers, and many lost ground to their respective benchmarks during the quarter. It is significant to note that following the end of the quarter, interest rates reversed course, the market broadened out and active management results have improved significantly as we approach the end of October.
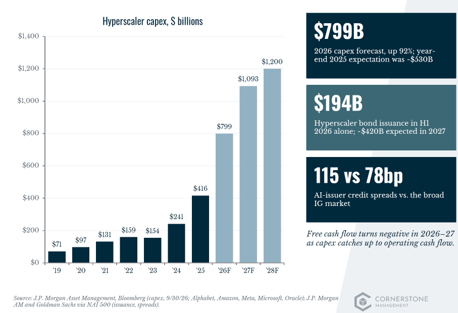
Moving into the final quarter of 2026, we remain optimistic that equities will rally into year end. However, the concentration element remains a relatively unknown variable. Diversifying sub-asset classes like small cap stocks, REITs, and mid cap continue to be significantly affected by short-term interest rate moves and their linkage to AI. In many ways AI has been the tide that has lifted all boats, but underneath the surface, many stocks are not participating. While we remain optimistic regarding the future impact of AI on both the American and global economy, we believe that we must remain diversified. Further, fixed income returns over the last five years have been quite poor, but interest rates have risen significantly, and the best predictor of future fixed income returns is yield to maturity. This variable has risen significantly. In a recent interview Dan Ivascyn, a manager of the Pimco Income Fund, noted that the fund’s current yield to maturity was approximately 8%. This is the highest yield that we have seen in one of our core plus bond funds in quite some time.
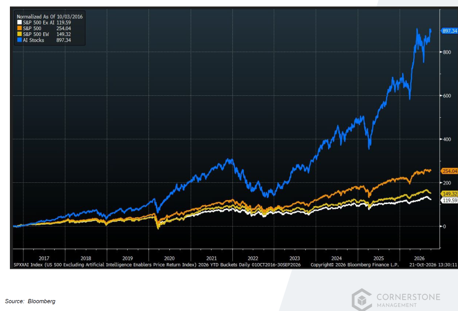
On the flip side, when equities have experienced extremely high returns as they have for the last five years, future returns also often revert toward the mean. Equity performance could slow, or areas of the market that have not really participated in this rally and are relatively cheap could begin to outperform those that have been in the spotlight. Market concentration and overlap are reminiscent of the late 90s, and investors would do well to ensure that their portfolios are truly diversified and, thus, are prepared for a market pullback or a significant decline in major AI-related names.
For additional information about Cornerstone Management or this report, please contact Bryan Taylor or
Chad Crawford at:
770-449-7799
bryan@cornerstonemgt.net
chad@cornerstonemgt.net
Cornerstone Management Inc. is a Registered Investment Advisory Firm. Although the information in this report has been obtained from sources that the Firm believes to be reliable, we do not guarantee its accuracy, and any such information may be incomplete or condensed. All opinions included in this report constitute the Firm’s judgment as of the date of this report and are subject to change without notice. This report is for informational purposes only and is not intended as an offer or solicitation with respect to the purchase or sale of any security. This report may only be dispensed with this disclosure attached.