Cornerstone 2nd Quarter 2024 Commentary

August 6, 2024
A Hollowing Out…
As for it being different this time it is different every time. The question is in what way, and to what extent
Bob Farrell’s Rules for Investing:
#3 There are no new eras – excesses are never permanent
#7. Markets are strongest when they are broad and weakest when they narrow a handful of blue-chip names
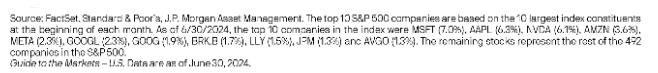
The second quarter began with a pull back and ended with a rally. Large Cap U.S. Tech continued its march upward like a never ending game of musical chairs investors continue to play. One can only wonder when the music will stop! There have been few quarters that looked so good on the surface, but the underlying story was quite different than the shiny veneer that many investors witnessed. A quick glance at the numbers suggests that the market roared higher during the second quarter of 2024. Major equity indices moved up significantly, and one could be forgiven for thinking that all was well with global equity markets. However, a closer look reveals a significant hollowing out of the market as both individual sectors and entire asset classes lost ground while U.S. Tech and the Magnificent 7 continued to drive broader indexes higher. This may be most easily seen when comparing the S&P 500 Composite Index (capitalization weighted) vs. the S&P 500 Equal Weighted Index (equally weighted). The two indexes comprise the same securities, but for the second quarter, the performance could not be more different. The S&P 500 Composite Index – the one investors are used to seeing reported in the newspaper or on TV – was up 4.28%, while its equal weighted counterpart was actually down 2.63%.
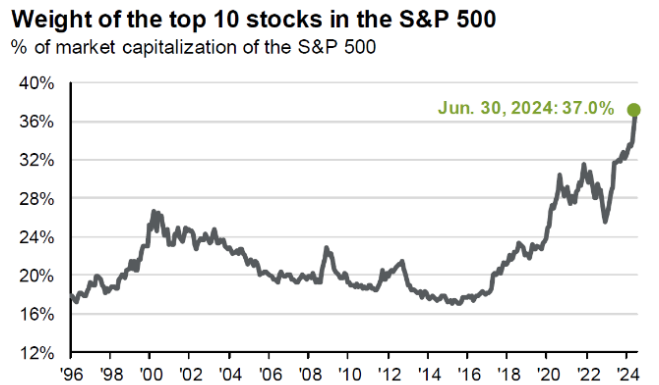
As our quote from Bob Farrell’s Rules for Investing notes, markets are always stronger when they are broader. This bull market continues to narrow, and the second quarter clearly showed the disconnect between big U.S. tech stocks and the remainder of the market. Other diversifying sectors and asset classes like small cap stocks and REITs were negative for the quarter as well. It is difficult to convince people how much capitalization skews the index and the significance of the size differential. While we have been talking about it for some time, it remains the single most significant explanatory component related to a portfolio’s relative returns in 2024. Any diversified portfolio will struggle to keep up in such a market. Further, diversification will actually appear foolish in a momentum-driven, highly concentrated market. It is actually in times like these that one must focus on longer term objectives and remain dedicated to long term strategic asset allocation decisions. That is not to say that investment in the high performers is a bad thing. CMI portfolios and many others have exposure to the tech sector and the top 7 stocks that have been driving the market. In many of our portfolios, we have actually utilized passive exposure that accesses the largest stocks in the growth sector at their market weightings. However, this exposure is offset by our determination to remain committed to our longer term, strategic, policy-driven allocation models.
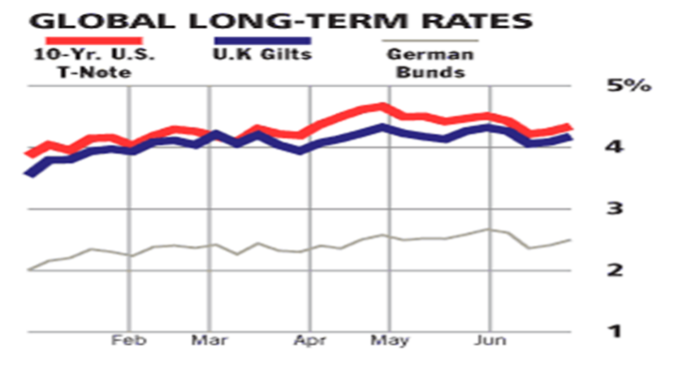
Capitalization-weighted benchmarks are always drifting in one direction or the other. We recently conducted a study of “growth” exposure in the broad Morgan Stanley Capital Index All Country World Index (MSCI ACWI). Growth has risen to 59% of the index weight. The performance of U.S. Growth has also resulted in the index drifting in a U.S.-centric direction and has increased the benchmark’s weight to large cap in the process. The diversity of performance highlights both the challenge of “keeping up” with the benchmark in such circumstances while also exposing the dangers of allowing a portfolio to drift in the direction of the current high performing areas of the market. An investor can easily become overexposed to a particular area of the equity universe and take on significantly more risk than he or she intended. Continued concerns about economic growth, the decline in inflation, and corporate earnings not only impacted equity markets, but they also had a significant impact on fixed income markets. The FED remained on hold throughout the quarter, but expectations around FED action ebbed and flowed throughout the three month period. Initially investors feared that growth was too strong and that the FED would be forced to delay cutting interest rates until late in 2024 or perhaps even 2025, but late in the quarter a string of weaker economic data points and a cooling labor market dampened inflationary fears and led to a bond rally. While not particularly strong, the rally offset some of the losses earlier in the quarter and allowed the broader bond market to finish the second quarter in the black. Still, the negative return by the Bloomberg US Aggregate Bond Index in the first half of 2024 was a bit disappointing.
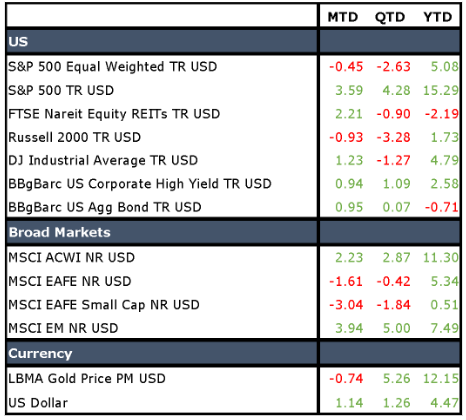
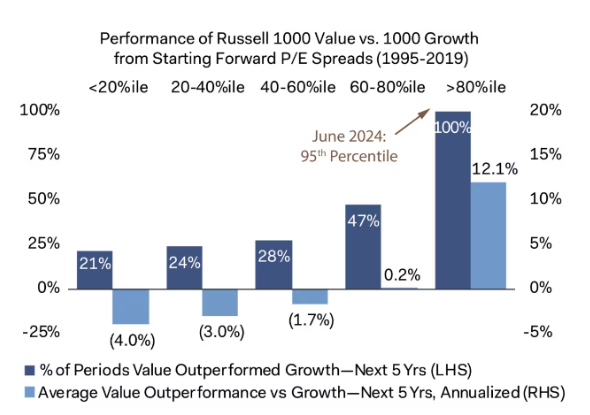
As we noted, U.S. Growth stocks continued to dominate markets during the second quarter. The Russell 1000 Growth Index climbed 8.33% for the quarter and ended the first half up more than 20%. Following a stunning performance in 2023, it remains to be seen just how much further growth can run before experiencing a negative adjustment. The Russell 1000 Value Index actually declined 2.17% during the quarter but was up 6.62% for the first half of the year. Under most circumstances the year to date return would have been hailed by investors as a substantial win, but it pales in the face of the returns experienced by its growth counterpart. Rarely have we experienced such a huge divergence between growth and value. This period of growth outperformance, while not unprecedented, is quite significant. In the past such periods have usually been followed by strong value performance.
Small cap stocks did not fare particularly well during the quarter. The Russell 2000 Value Index declined 3.64% for the quarter, and the Russell 2000 Growth Index was down 2.92% for the same period. The dichotomy between the Russell 1000 Growth Index and the Russell 2000 Growth index is quite stark…approximately 16 percentage points separate the two indexes for the first half of 2024.
The perception of an economic softening late in the quarter boosted REITs along with fixed income, but it was too little, too late. REITs declined 90 basis points during the second quarter and are down a bit over 2% for the year-to-date period. Investors continue to be leery of the asset class due to continued concerns around traditional office space. In the new “work from home” era it seems that investors are fixated on the negative impact on office space despite the fact that the REIT asset class has broadened and traditional office exposure is a limited part of most REIT portfolios. The Treasury Yield Curve remained inverted throughout the second quarter. Although yields remain high, they were not enough to offset fears of a strong economy, and consequently bonds provided little safety during the second quarter. The late quarter rally helped a bit and allowed the Bloomberg U.S. Aggregate Bond Index to eke out a small gain, but it was less than impressive. While we were disappointed, we believe that softer economic data in the second half of 2024 coupled with the cumulative effect of a higher current yield will result in positive performance for the index.

Cornerstone’s fixed income portfolios continue to benefit from strong active manager performance, a slight underweight in duration, and exposure to various spread products. We have also allowed our cash positions to drift higher to capitalize on the strong yield and low volatility of short-term Treasuries.
International securities struggled during the second quarter. The MSCI EAFE index, without the benefit of U.S. Tech, drifted lower and fell 42 basis points during the quarter. The MSCI EAFE Small Cap Index declined as well, but Emerging Markets equities turned in a solid performance up 5% for the quarter and over 7% on a year-to-date basis. A falling U.S. Dollar allowed the Bloomberg Global Aggregate Bond Index to remain positive for the quarter and end the first half up 0.69%.
For diversified investors, the second quarter of 2024 was a disappointment. Capitalization- weighted index strategies posted excellent returns, and market participants who were primarily exposed to the largest stocks in the U.S. were undoubtedly pleased with their results. However, valuations gaps continue to widen. David Hoeft, CIO at Dodge and Cox, recently pointed out that the Russell 1000 Growth trades at 28.8 times earnings vs 16.1 for the Russell 1000 Value. Only 5% of the time has the gap been wider. A similar situation exists with international stocks. The MSCI EAFE is trading over two standard deviations below its normal realtionship to U.S. quities. In such an environment we find our value tilt to be comforting indeed, and we expect that it will prove helpful in the future. We have not lost our faith in the power of diversification. As recently as 2022 investors experienced the impact of sudden massive declines in the tech sector. Dampening volatilty through the utilization of long term strategic allocation and counter cyclical rebalancing is a proven methodology and one which we have no intention of giving up!
For additional information about Cornerstone Management or this report, please contact
Bryan Taylor or Chad Crawford
770-449-7799
bryan@cornerstonemgt.net
chad@cornerstonemgt.net
Cornerstone Management Inc. is a Registered Investment Advisory Firm. Although the information in this report has been obtained from sources that the Firm believes to be reliable, we do not guarantee its accuracy, and any such information may be incomplete or condensed. All opinions included in this report constitute the Firm’s judgment as of the date of this report and are subject to change without notice. This report is for informational purposes only and is not intended as an offer or solicitation with respect to the purchase or sale of any security. This report may only be dispensed with this disclosure attached.